Reversal Patterns
స్టాక్ మార్కెట్ లో విజయవంతమైన ట్రేడింగ్ కోసం అవసరమైన కీలక అంశాలలో Reversal Patterns ను అర్థం చేసుకోవడం చాలా ముఖ్యం. ట్రెండ్ ఎప్పుడు మారబోతుందో సూచించే ఈ ప్యాటర్న్లు ట్రేడర్లకు విలువైన ఇన్సైట్స్ అందిస్తాయి. ఈ బ్లాగ్ పోస్ట్లో, మనం Reversal Patterns అంటే ఏమిటి, అవి ఎందుకు ముఖ్యమైనవి, మరియు సాధారణంగా కనిపించే కొన్ని bullish మరియు bearish reversal patterns గురించి వివరంగా చర్చిద్దాం.
What are Reversal Patterns?
Reversal Patterns అనేవి Basics of Stock market లోని ఒక ముఖ్యమైన భాగం. ఒక స్టాక్ లేదా ఇండెక్స్ యొక్క ప్రస్తుత Price Movement లో మార్పు రాబోతుందని సూచించే chart patterns ను Reversal Patterns అంటారు. అంటే, ఒక up-trend down-trend గా లేదా down-trend up-trend గా మారబోతుందని ఇవి సంకేతం ఇస్తాయి. Stock Market Library లో మీరు వీటి గురించి మరింత సమాచారం పొందవచ్చు. ఈ patterns ను గుర్తించడం ద్వారా, ట్రేడర్లు తమ position ను మార్చుకోవడానికి లేదా కొత్త ట్రేడ్లు తీసుకోవడానికి సిద్ధపడతారు.
Common Bullish Reversal Patterns
Bearish trend నుంచి Bullish trend కు మారే అవకాశం ఉందని సూచించే patterns ను Bullish Reversal Patterns అంటారు. వీటిలో కొన్ని ముఖ్యమైనవి:
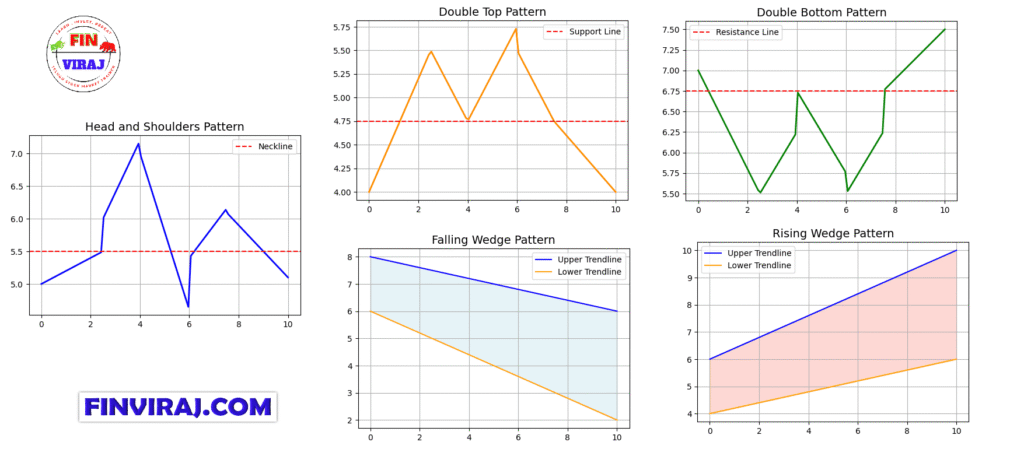
- Double Bottom: ఇది ‘W’ ఆకారంలో ఉంటుంది. రెండు దాదాపు సమానమైన low points ను ఏర్పరచి, వాటి మధ్య ఒక high point తో కనిపిస్తుంది. ఇది Strong Fibonacci course Support zone ను సూచిస్తుంది.
- Triple Bottom: Double Bottom లాగానే, కానీ మూడు low points ఉంటాయి. ఇది మరింత బలమైన bullish reversal ను సూచిస్తుంది.
- Inverse Head and Shoulders (Head and Shoulders Bottom): ఇది ఒక shoulder, head (లోతైన low), మరియు మరొక shoulder ను కలిగి ఉంటుంది. ఇది down-trend ముగిసి up-trend ప్రారంభం కాబోతుందని సూచిస్తుంది.
- Falling Wedge: ఇది రెండు converge అవుతున్న downward-sloping trend lines తో ఏర్పడుతుంది. ఇది bullish reversal కు దారితీస్తుంది.
- Hammer/Morning Star: Candlestick patterns లో ఇవి down-trend తర్వాత వచ్చే bullish reversal ను సూచిస్తాయి. Future and Options (F&O) ట్రేడర్స్ ఇటువంటి patterns ను ఉపయోగించి తమ strategies ను ప్లాన్ చేసుకుంటారు.
Common Bearish Reversal Patterns
Bullish trend నుంచి Bearish trend కు మారే అవకాశం ఉందని సూచించే patterns ను Bearish Reversal Patterns అంటారు. వీటిలో కొన్ని ముఖ్యమైనవి:
- Double Top: ఇది ‘M’ ఆకారంలో ఉంటుంది. రెండు దాదాపు సమానమైన high points ను ఏర్పరచి, వాటి మధ్య ఒక low point తో కనిపిస్తుంది. ఇది Strong Resistance zone ను సూచిస్తుంది.
- Triple Top: Double Top లాగానే, కానీ మూడు high points ఉంటాయి. ఇది మరింత బలమైన bearish reversal ను సూచిస్తుంది.
- Head and Shoulders Top: ఇది ఒక shoulder, head (ఎత్తైన high), మరియు మరొక shoulder ను కలిగి ఉంటుంది. ఇది up-trend ముగిసి down-trend ప్రారంభం కాబోతుందని సూచిస్తుంది.
- Rising Wedge: ఇది రెండు converge అవుతున్న upward-sloping trend lines తో ఏర్పడుతుంది. ఇది bearish reversal కు దారితీస్తుంది.
- Shooting Star/Evening Star: Candlestick patterns లో ఇవి up-trend తర్వాత వచ్చే bearish reversal ను సూచిస్తాయి. Options Selling చేసే వారికి ఈ patterns చాలా ఉపయోగపడతాయి.
How to Trade Reversal Patterns
Reversal Patterns ను గుర్తించడం ఒక భాగం, వాటిని సమర్థవంతంగా ట్రేడ్ చేయడం మరో భాగం. ఇక్కడ కొన్ని కీలక సూచనలు ఉన్నాయి:
Importance of Confirmation
ఏ Reversal Pattern కనిపించినా, దానికి Confirmation లభించడం చాలా అవసరం. Volume పెరుగుదల, trend line break అవుట్, లేదా ఇతర indicators ద్వారా confirmation తీసుకోవాలి. కేవలం pattern చూసి ట్రేడ్ లోకి ఎంటర్ అవ్వడం రిస్క్.
Risk Management
Reversal Patterns ను ట్రేడ్ చేసేటప్పుడు Mentorship తీసుకోవడం మరియు సరైన Risk Management పాటించడం చాలా ముఖ్యం. Stop Loss ను ఎల్లప్పుడూ ఏర్పాటు చేసుకోవాలి. ఇది అనవసరమైన నష్టాల నుండి మిమ్మల్ని రక్షిస్తుంది. Swing Trading లేదా Scalping strategies లో కూడా Risk Management ప్రధాన పాత్ర పోషిస్తుంది.
మరింత సమాచారం కోసం, మీరు NSE India మరియు SEBI మార్గదర్శకాలను కూడా చూడవచ్చు.
ముగింపు:
Reversal Patterns ను అర్థం చేసుకోవడం మరియు వాటిని సరిగ్గా విశ్లేషించడం మీ ట్రేడింగ్ సామర్థ్యాన్ని గణనీయంగా మెరుగుపరుస్తుంది. సరైన knowledge తో మరియు practice తో, మీరు మార్కెట్ లోని మార్పులను ముందుగానే గుర్తించి, లాభదాయకమైన నిర్ణయాలు తీసుకోవచ్చు. మా All courses page లోని advanced courses ద్వారా మీ నైపుణ్యాలను మరింత మెరుగుపరుచుకోండి.
FAQ: Frequently Asked Questions about Reversal Patterns
What are Reversal Patterns in stock market?
Reversal Patterns అనేవి stock chart లలో కనిపించే patterns. ఇవి ఒక current trend (అది up-trend లేదా down-trend కావచ్చు) యొక్క దిశ మారబోతుందని సూచిస్తాయి. అంటే, prices ఒక దిశలో కదలికను ఆపి, వ్యతిరేక దిశలో కదలడం ప్రారంభించవచ్చని ఇవి సంకేతం ఇస్తాయి.
Why are Reversal Patterns important for traders?
Reversal Patterns ట్రేడర్లకు ముఖ్యమైనవి, ఎందుకంటే అవి మార్కెట్ లోని potential trend changes ను ముందుగానే గుర్తించడానికి సహాయపడతాయి. ఈ patterns ను గుర్తించడం ద్వారా, ట్రేడర్లు తమ trades లో లాభాలను maximize చేసుకోవడానికి లేదా నష్టాలను minimise చేసుకోవడానికి సమయానుకూల నిర్ణయాలు తీసుకోవచ్చు. ఇది వారి Risk Management కు కూడా సహాయపడుతుంది.
What are some common bullish Reversal Patterns?
కొన్ని సాధారణ bullish Reversal Patterns లో Double Bottom, Triple Bottom, Inverse Head and Shoulders, మరియు Falling Wedge వంటివి ఉంటాయి. ఇవి down-trend ముగిసి up-trend ప్రారంభం కాబోతుందని సూచిస్తాయి.
What are some common bearish Reversal Patterns?
కొన్ని సాధారణ bearish Reversal Patterns లో Double Top, Triple Top, Head and Shoulders Top, మరియు Rising Wedge వంటివి ఉంటాయి. ఇవి up-trend ముగిసి down-trend ప్రారంభం కాబోతుందని సూచిస్తాయి.
How accurate are Reversal Patterns?
Reversal Patterns స్టాక్ మార్కెట్ లో trend reversals ను గుర్తించడానికి చాలా సమర్థవంతమైన టూల్స్. అయితే, ఏ pattern కూడా 100% ఖచ్చితమైనది కాదు. వాటిని ఇతర technical indicators, volume analysis, మరియు overall market sentiment తో కలిపి ఉపయోగించినప్పుడు వాటి accuracy పెరుగుతుంది. ట్రేడింగ్ నిర్ణయాలు తీసుకునే ముందు ఎల్లప్పుడూ confirmation కోసం చూడాలి.
Educational financial content for learning and awareness.
Thank you sir
Diagram vesithey bhaguntundi sir
This is very valuable content and thanks for sharing all these details that too in Telugu… Thank you and if possible please add small snips for exa.mples.
Super message sir
Anni patterns lo oka ol kottha points unnai it’s valuable information thank you very much sir
With charts tho explain cheyandi guruvu gaaru inka baaga artham chesukuntaaru..if u don’t mind