Inverted Hammer Pattern
స్టాక్ మార్కెట్ లో సక్సెస్ అవ్వాలంటే, చార్ట్స్ ని అర్థం చేసుకోవడం చాలా ముఖ్యం. అందులో ముఖ్యంగా Candlestick Patterns గురించి తెలుసుకోవాలి. ఈ రోజు మనం ఒక పవర్ఫుల్ Candlestick Pattern గురించి డిస్కస్ చేద్దాం – అదే Inverted Hammer Pattern. ఇది మార్కెట్ లో ట్రెండ్ రివర్సల్స్ ని కనిపెట్టడానికి చాలా హెల్ప్ చేస్తుంది. Downward Trend తర్వాత ఏర్పడే ఈ పాటర్న్, మార్కెట్ లో Buying Pressure పెరుగుతోంది అని సూచిస్తుంది.
What is an Inverted Hammer Candlestick?
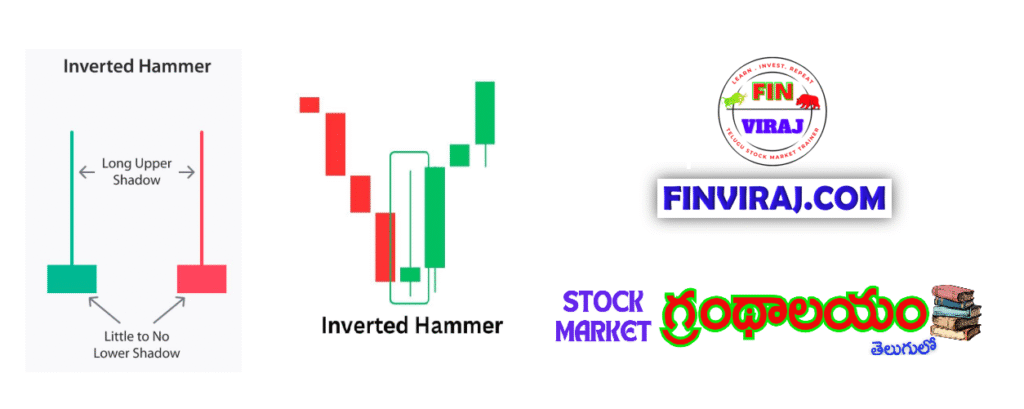
అసలు ఈ Inverted Hammer Candlestick అంటే ఏంటి? పేరులోనే ఉంది, ఇది తలక్రిందులుగా ఉన్న సుత్తి లాగా ఉంటుంది. దీనికి ఒక చిన్న Real Body ఉంటుంది (అది Green అయినా Red అయినా పర్లేదు), ఒక పొడవైన Upper Shadow ఉంటుంది, కానీ Lower Shadow చాలా తక్కువగా లేదా అసలు ఉండదు. ఈ Real Body అడుగున ఉంటుంది. పొడవైన Upper Shadow అనేది, ఆ రోజు ట్రేడింగ్ లో Buyers ప్రైస్ ని పైకి తీసుకెళ్లడానికి ఎంత ప్రయత్నించారో చూపిస్తుంది, కానీ సెషన్ ముగిసే సమయానికి Sellers మళ్ళీ ప్రైస్ ని కిందకి తోసారు అని అర్థం.
How to Identify the Inverted Hammer Pattern?
Inverted Hammer Pattern ని ఎలా గుర్తించాలి? చాలా సింపుల్ స్టూడెంట్స్! ఈ పాటర్న్ ని గుర్తించడానికి కొన్ని ముఖ్యమైన లక్షణాలు ఉన్నాయి:
- Previous Trend: ఈ పాటర్న్ ఎప్పుడూ ఒక Downward Trend తర్వాత మాత్రమే రావాలి. మార్కెట్ పడుతూ ఉండాలి.
- Real Body: చిన్న Real Body ఉండాలి. అది Bullish (Green) లేదా Bearish (Red) అవ్వచ్చు. Color అంత ముఖ్యం కాదు, దాని లొకేషన్ మరియు Upper Shadow పొడవు ముఖ్యం.
- Upper Shadow: Upper Shadow అనేది Real Body కన్నా కనీసం రెండు రెట్లు పొడవుగా ఉండాలి. ఇది Buyers ఎంత బలంగా ప్రైస్ ని పైకి నెట్టడానికి ప్రయత్నించారో చూపిస్తుంది.
- Lower Shadow: చాలా చిన్నగా లేదా అసలు ఉండకూడదు.
- Location: ఈ Candlestick, Downward Trend చివరిలో, ఒక Potential Support Level దగ్గర ఏర్పడాలి.
Interpretation and Significance
ఈ Inverted Hammer Pattern మార్కెట్ లో ఏం చెబుతుంది? ఇది ఒక Bullish Reversal Candlestick Pattern. అంటే, మార్కెట్ లో Price పడుతూ ఉన్నప్పుడు, ఒకానొక పాయింట్ లో Buyers మళ్ళీ రంగంలోకి దిగి ప్రైస్ ని పైకి తీసుకెళ్లడానికి ప్రయత్నించారు అని అర్థం. Upper Shadow ఎంత పొడవు ఉంటే, Buyers అంత స్ట్రాంగ్ గా ఉన్నారని అర్థం. అయితే, Sellers మళ్ళీ ప్రైస్ ని కిందికి తోశారు కాబట్టి, Real Body చిన్నగా ఉంటుంది. కానీ, దీని తర్వాత Market Trend మారొచ్చు అనే సంకేతం ఇస్తుంది. దీన్ని మీరు Basics of Stock market లోని ఇతర Candlestick Patterns తో కలిపి చూస్తే మరింత క్లారిటీ వస్తుంది.
Trading Strategy with Inverted Hammer
ఈ Inverted Hammer Pattern ని చూసి ఎలా ట్రేడ్ చేయాలి? ఇది చాలా మంది అడిగే ప్రశ్న. ఇక్కడ ఒక సింపుల్ ట్రేడింగ్ స్ట్రాటజీ ఉంది:
- Confirmation: Inverted Hammer ఏర్పడిన వెంటనే ట్రేడ్ లోకి ఎంటర్ అవ్వద్దు. దీని తర్వాత ఒక Bullish Candlestick (అంటే, Green క్యాండిల్) రావాలి. అది ప్రీవియస్ క్యాండిల్ హై ని బ్రేక్ చేస్తేనే Confirmation. Volume కూడా ఎక్కువగా ఉండాలి.
- Entry: Confirmation Candlestick హై ని బ్రేక్ చేసిన తర్వాత Entry తీసుకోవచ్చు.
- Stop Loss: Inverted Hammer Candlestick యొక్క లో పాయింట్ దగ్గర Stop Loss పెట్టుకోవాలి. ఇది మీ క్యాపిటల్ ని సేఫ్ గా ఉంచుతుంది.
- Target: మీరు Risk-Reward Ratio ని బట్టి Target సెట్ చేసుకోవచ్చు. పాత Resistance Levels ని కూడా Target గా తీసుకోవచ్చు. Remember, Swing Trading లో ఇలాంటి పాటర్న్స్ చాలా useful.
Key Considerations and Limitations
Inverted Hammer Pattern చాలా పవర్ఫుల్ అయినప్పటికీ, కొన్ని విషయాలు గుర్తుపెట్టుకోవాలి:
- Volume: Confirmation Candlestick ఏర్పడేటప్పుడు Volume ఎక్కువగా ఉంటే, ఆ Signal మరింత స్ట్రాంగ్ అని అర్థం.
- Other Indicators: కేవలం ఒక Candlestick Pattern మీదనే ఆధారపడకుండా, RSI, Moving Averages వంటి ఇతర Stock Market Library లోని Technical Analysis Indicators ని కూడా ఉపయోగించండి.
- Market Conditions: Overall Market Trend ని కూడా అనలైజ్ చేయండి. ఇది ఒక Isolation లో కాకుండా, మొత్తం మార్కెట్ కాంటెక్స్ట్ లో చూడాలి.
- Practice: ప్రాక్టీస్ మేక్స్ పర్ఫెక్ట్. మీరు చార్ట్స్ ని చూస్తూ ఈ పాటర్న్ ని గుర్తించడం నేర్చుకోవాలి. మా Mentorship ప్రోగ్రామ్ లో ఇలాంటి వాటిపై డీటెయిల్డ్ గైడెన్స్ ఉంటుంది.
సో, స్టూడెంట్స్! Inverted Hammer Pattern అనేది స్టాక్ మార్కెట్ లో ఒక potential Bullish Reversal ని సూచించే ఒక ముఖ్యమైన Candlestick Pattern. దీన్ని సరిగ్గా అర్థం చేసుకుని, సరైన Confirmation తో ట్రేడ్ చేస్తే మీరు మంచి లాభాలు సంపాదించవచ్చు. మర్చిపోవద్దు, ఎప్పుడూ రిస్క్ మేనేజ్మెంట్ ని పాటించాలి. మరిన్ని ట్రేడింగ్ స్ట్రాటజీస్ మరియు కోర్సుల కోసం మా All courses page ని విజిట్ చేయండి!
Frequently Asked Questions (FAQs)
Q1: Inverted Hammer Pattern అంటే ఏమిటి?
Inverted Hammer Pattern అనేది ఒక Bullish Reversal Candlestick Pattern. ఇది Downward Trend చివరిలో ఏర్పడి, మార్కెట్ లో ప్రైస్ పైకి వెళ్ళే అవకాశం ఉందని సూచిస్తుంది. దీనికి చిన్న Real Body, పొడవైన Upper Shadow, మరియు చాలా చిన్న Lower Shadow ఉంటాయి.
Q2: Inverted Hammer Pattern అనేది ఎప్పుడు Bullish గా పరిగణించబడుతుంది?
ఈ పాటర్న్ ఎప్పుడూ Downward Trend తర్వాత ఏర్పడినప్పుడే Bullish Reversal Signal గా పరిగణించబడుతుంది. దీని తర్వాత వచ్చే Candlestick, Inverted Hammer హై ని బ్రేక్ చేస్తే Confirmation వస్తుంది. Volume ఎక్కువగా ఉంటే మరింత స్ట్రాంగ్.
Q3: Inverted Hammer Pattern, Shooting Star Pattern ఒకటేనా?
కాదు, Inverted Hammer మరియు Shooting Star Patterns రెండు ఒకేలా కనిపించినా, వాటి Signal వేరు. Inverted Hammer Downward Trend తర్వాత ఏర్పడి Bullish Reversal ని సూచిస్తే, Shooting Star Upward Trend తర్వాత ఏర్పడి Bearish Reversal ని సూచిస్తుంది.
Q4: ఈ Pattern ను ట్రేడింగ్ లో ఎలా ఉపయోగించాలి?
Inverted Hammer Pattern ఏర్పడిన తర్వాత, ఒక Bullish Confirmation Candlestick కోసం వేచి ఉండాలి. ఆ Confirmation తర్వాత ట్రేడ్ లోకి Entry తీసుకుని, Inverted Hammer లో పాయింట్ దగ్గర Stop Loss పెట్టుకోవాలి. Target ని Risk-Reward Ratio లేదా Resistance Levels బట్టి సెట్ చేసుకోవచ్చు.
Q5: Inverted Hammer Pattern తో పాటు ఏ ఇతర Indicators చూడాలి?
Volume, RSI (Relative Strength Index), Moving Averages వంటి ఇతర Technical Analysis Indicators ని కూడా Inverted Hammer Pattern తో పాటు చూడటం వల్ల మీ ట్రేడింగ్ Signal మరింత బలపడుతుంది. ఎప్పుడూ multiple confirmations కోసం చూడాలి.