Continuation Patterns
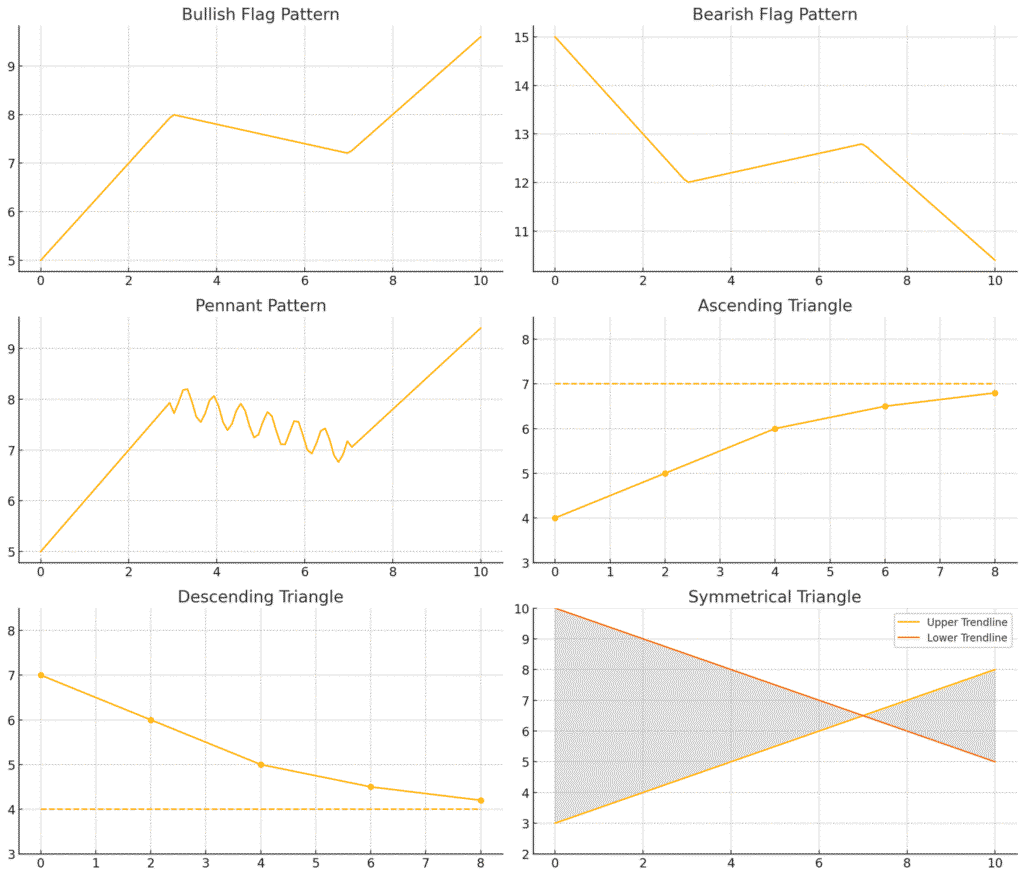
📈 Bullish Flag Pattern
📉 Bearish Flag Pattern
🔰 Pennant Pattern
⬆️ Ascending Triangle
⬇️ Descending Triangle
🔺 Symmetrical Triangle
స్టాక్ మార్కెట్లో ట్రేడింగ్ చేసేవారికి, మార్కెట్ కదలికలను ముందుగానే అంచనా వేయడం చాలా ముఖ్యం. దీనికి Technical Analysisలోని వివిధ నమూనాలు (Patterns) ఎంతో సహాయపడతాయి. అలాంటి ముఖ్యమైన నమూనాలలో ఒకటి Continuation Patterns. ఈ Patterns ప్రస్తుత Price Movementలో తాత్కాలిక విరామం తర్వాత, అదే Trend కొనసాగుతుందని సూచిస్తాయి. ఒక Trend బలమైనదిగా ఉన్నప్పుడు, అది అప్పుడప్పుడు Pause తీసుకుని మళ్ళీ తన ప్రయాణాన్ని కొనసాగిస్తుంది. ఈ విరామ సమయాల్లో ఏర్పడేదే Continuation Pattern. వీటిని సరిగ్గా గుర్తించడం ద్వారా మీరు Potential Entry మరియు Exit Pointsను గుర్తించి, మీ ట్రేడింగ్లో లాభాలను పెంచుకోవచ్చు. Basics of Stock market నుండి Advanced Concepts వరకు నేర్చుకోవాలనుకునే వారికి ఈ Patterns చాలా ఉపయోగపడతాయి.
What are Continuation Patterns?
Continuation Patterns అనేవి ఒక Trend మధ్యలో ఏర్పడే గ్రాఫికల్ షేప్స్. ఇవి ప్రస్తుత మార్కెట్ Trend తాత్కాలికంగా ఆగిపోయి, కొంత కన్సాలిడేషన్ (Consolidation) తర్వాత మళ్ళీ అదే దిశలో కొనసాగుతుందని సూచిస్తాయి. ఒక Bullish Trendలో ఏర్పడితే, అది పైకి వెళ్ళే Trend కొనసాగుతుందని అర్థం. అదే ఒక Bearish Trendలో ఏర్పడితే, అది క్రిందకి వెళ్ళే Trend కొనసాగుతుందని అర్థం. ఈ Patterns Trend Reversalను సూచించవు, బదులుగా Trend యొక్క Strengthను ధృవీకరిస్తాయి.
Key Characteristics of Continuation Patterns
- Temporary Pause: బలమైన Trendలో ఏర్పడే ఒక చిన్న విరామం.
- Consolidation: Pattern ఏర్పడేటప్పుడు ధర ఒక నిర్దిష్ట పరిధిలో కదలాడుతుంది.
- Volume: సాధారణంగా, Pattern ఏర్పడే సమయంలో Volume తగ్గుతుంది మరియు Breakout వచ్చినప్పుడు Volume పెరుగుతుంది.
Types of Continuation Patterns
Continuation Patterns అనేక రూపాల్లో ఉంటాయి. వాటిలో కొన్ని ముఖ్యమైనవి ఇక్కడ చూద్దాం:
Flags and Pennants
Flags: ఇవి చిన్న, సమాంతర లేదా కొద్దిగా వ్యతిరేక దిశలో ఉండే ఛానెల్స్ లాగా కనిపిస్తాయి. బలమైన Price Movement (Flagpole) తర్వాత ఏర్పడతాయి. Bullish Flagలో ధర పెరుగుతున్నప్పుడు ఏర్పడి, మళ్ళీ పైకి Breakout అవుతుంది. Bearish Flagలో ధర తగ్గుతున్నప్పుడు ఏర్పడి, మళ్ళీ క్రిందకు Breakout అవుతుంది.
Pennants: Flags లాగానే, Pennants కూడా బలమైన Price Movement తర్వాత ఏర్పడతాయి, కానీ ఇవి ఒక చిన్న Symmetric Triangle ఆకారంలో ఉంటాయి. Pennant ఏర్పడే సమయంలో Volume తగ్గుతుంది, Breakout వద్ద పెరుగుతుంది. Pennants కూడా Bullish లేదా Bearish కావచ్చు.
Rectangles
Rectangle Patternలో, ధర రెండు సమాంతర Support and Resistance స్థాయిల మధ్య కదలాడుతుంది. కొంత కాలం కొనసాగి, ఆ తర్వాత ప్రస్తుత Trend దిశలో ఏదో ఒక వైపున Breakout అవుతుంది. Swing Tradingలో ఇలాంటి Patterns తరచుగా కనిపిస్తాయి.
Triangles
ట్రయాంగిల్స్ అనేవి అత్యంత సాధారణ మరియు విశ్వసనీయమైన Continuation Patternsలో ఒకటి. వీటిలో మూడు రకాలున్నాయి:
- Symmetric Triangle: Convergence అవుతున్న రెండు Trend Lines ద్వారా ఏర్పడుతుంది. ఇది Bullish లేదా Bearish Trend కొనసాగుతుందని సూచిస్తుంది.
- Ascending Triangle: ఇందులో Upper Trend Line ఫ్లాట్గా ఉంటుంది (Resistance), Lower Trend Line పైకి వెళుతుంది (Higher Lows). ఇది Bullish Continuation Pattern.
- Descending Triangle: ఇందులో Lower Trend Line ఫ్లాట్గా ఉంటుంది (Support), Upper Trend Line క్రిందకు వెళుతుంది (Lower Highs). ఇది Bearish Continuation Pattern.
Wedges
Wedges కూడా Triangles లాగే కనిపిస్తాయి, కానీ వాటి Trend Lines రెండూ ఒకే దిశలో వాలుతాయి. Rising Wedge అనేది Bearish Continuationను సూచిస్తుంది, Falling Wedge అనేది Bullish Continuationను సూచిస్తుంది. Fibonacci course నేర్చుకునేటప్పుడు ఈ Patternsను మరింత లోతుగా విశ్లేషించవచ్చు.
Trading Strategies with Continuation Patterns
Continuation Patternsను ఉపయోగించి ట్రేడింగ్ చేసేటప్పుడు కొన్ని సూత్రాలను పాటించాలి:
- Confirmation: Pattern నుండి స్పష్టమైన Breakout వచ్చేవరకు ట్రేడ్ చేయకూడదు. Volumeతో ధృవీకరించబడాలి.
- Entry Point: Breakout తర్వాత లేదా Retest తర్వాత Entry తీసుకోవచ్చు.
- Stop Loss: Pattern యొక్క Support లేదా Resistance స్థాయికి వెలుపల Stop Lossను ఉంచాలి.
- Target: Flagpole యొక్క పొడవును లేదా Pattern యొక్క వెడల్పును కొలిచి Targetను నిర్ణయించవచ్చు. Swing Trading మరియు Scalping కోసం ఈ Strategy చాలా ఉపయోగపడుతుంది.
మరింత లోతైన సమాచారం కోసం మీరు NSE India వంటి అధికారిక వెబ్సైట్లను సందర్శించవచ్చు లేదా SEBI నిబంధనలను పరిశీలించవచ్చు.
Conclusion
Continuation Patterns అనేవి Technical Analysisలో చాలా శక్తివంతమైన టూల్స్. ఇవి మార్కెట్ యొక్క ప్రస్తుత Trendను అర్థం చేసుకోవడానికి మరియు భవిష్యత్ Price Movementను అంచనా వేయడానికి ట్రేడర్లకు సహాయపడతాయి. వీటిని సరిగ్గా గుర్తించి, సరైన Risk Managementతో ఉపయోగిస్తే, లాభదాయకమైన ట్రేడింగ్ అవకాశాలను అందిస్తాయి. మా అన్ని కోర్సులలో, ముఖ్యంగా Future and Options (F&O) మరియు Options Selling కోర్సులలో ఇలాంటి Advanced Conceptsను వివరంగా బోధిస్తాము. మీరు కూడా స్టాక్ మార్కెట్ విజేత కావాలనుకుంటే, FinViraj మీకు సరైన మార్గాన్ని చూపిస్తుంది.
Frequently Asked Questions (FAQs)
1. What is the main purpose of Continuation Patterns?
Continuation Patterns indicate that the current prevailing trend (either Bullish or Bearish) is likely to continue after a temporary pause or consolidation period. They help traders identify potential entry points to join the existing trend.
2. How are Continuation Patterns different from Reversal Patterns?
Continuation Patterns suggest that the existing trend will resume. In contrast, Reversal Patterns indicate that the current trend is likely to change direction (e.g., from Bullish to Bearish or vice-versa).
3. What are the most common types of Continuation Patterns?
The most common Continuation Patterns include Flags, Pennants, Rectangles, and Triangles (Symmetric, Ascending, and Descending). Each has unique characteristics that help in identifying the continuation of a trend.
4. Is Volume important when trading Continuation Patterns?
Yes, Volume is crucial. Typically, Volume decreases during the formation of a Continuation Pattern (consolidation phase) and significantly increases when the price breaks out of the pattern in the direction of the original trend. This increase in Volume confirms the Breakout.
5. Can Continuation Patterns be used in all markets?
Yes, Continuation Patterns are widely applicable across various financial markets, including equities, commodities, and Forex. They are a fundamental part of Technical Analysis and can be used in different timeframes, from Intraday to Long-Term charts.

prioritizing financial understanding and literacy, ensuring content remains educational rather than advisory.
Thank you so much sir 🙏
Really a good learning all of these thank a lot sirji
Thank you sir
TQ sir
Thank you sir